But here's the thing — I've been covering the Lobos all year, and I still can't tell if they're actually good. They might have one of the best records in the country right now, but the modern age of analytics has given us countless ways to measure more precisely why teams perform in the ways that they do.
What I mean to say here is that, despite the great record, despite the high-scoring offense, despite not having lost at the Pit since last February — despite it all, UNM just isn't as good as they are lucky.
KenPom, a holy scripture
A subscription to analytics site kenpom.com is, in my mind, the best 20 bucks a college hoops writer can spend. Ken Pomeroy has carved out a beautiful career of maintaining a comprehensive statistical archive of all 300+ NCAA D-I men's basketball team's tendencies since 2002, which today is used by teams all over the country in order to get a leg up on the competition.
A lot of what KenPom features focuses on quantifying a team's performance averaged over the course of a hypothetical 100 trips down the court, a subsect of basketball stats referred to as "per-100 possessions" which accounts for the varying tempos at which different teams play. In other words, some teams play faster than others, and per-100 stats level everything out so we can better contextualize a player or team's tendencies over a standardized hypothetical set of opportunities.
One of KenPom's featured per-100 metrics is called "Adjusted Efficiency Margin," which is a fancy, concise way to say "the net difference between Adjusted Offensive Efficiency and Adjusted Defensive Efficiency," which itself is a fancy, concise way to say "the difference between a team's projected points scored allowed for every 100 possessions adjusted for opponent strength."
Without getting into the nitty gritty, the best way to explain this is that Adjusted Efficiency Margin (AdjEM) is an estimate of a team's efficiency compared to the average D-I team. For example, Kansas currently leads KenPom's AdjEM category at +30.48, derived from the difference between its 114.4 Offensive Efficiency and 83.9 Defensive Efficiency ratings which project that, on average, Kansas would score 114.4 points against the average D-I defense and give up just 83.9 points to the average D-1 offense over the course of 100 possessions on either side. This is similar to the Net Rating calculation in the NBA.
Phew. Stay with me here. I promise this stuff is useful.
Here's the AdjEM rating of all 353 D-I teams so far this year, sorted by each team's winning percentage through January 23, 2020.

In a broad sense, this shows that these 79 teams are measurably better than UNM against the average, despite having a worse record.
On the bottom right, there are just three teams with a worse AdjEM and better record than UNM.
I made this to demonstrate what's already obvious — you can't rely on a team's record to measure how good they are. Just because UNM has a lot of wins does not mean that the Lobos are playing exceptionally well to get them.
We've seen UNM get off to countless slow starts this season, of which you're already well aware if you're one of the eight people that follow @rulljoe on Twitter. What's more, the lackluster AdjEM rating and slow starts are coming against pretty low-level opponents.
Who could forget the Lobos' inability to pull away from the lowly UC Davis (now just 8-12) and Fresno State (6-13) teams at home, or worse yet — the 48-46 home halftime deficit to (now 1-15) Houston Baptist on a day which saw the initial suspensions of JJ Caldwell (who remains suspended from the team) and Carlton Bragg (since permanently removed from the program)?
And these are just the home games. Let's not forget last week's back-to-back crushing losses at conference foes in Colorado State and UNLV, neither of which currently rank within the top 100 of ESPN's Basketball Power Index — of which, for the record, UNM has also fallen outside the top 100.
Suffice it to say, UNM hasn't exactly run the gauntlet so far this year. KenPom features a strength of schedule rating based largely on the same offensive and defensive metrics used for AdjEM. Here again are the 353 D-I teams graphed by their strength of schedule ratings and current winning percentages.
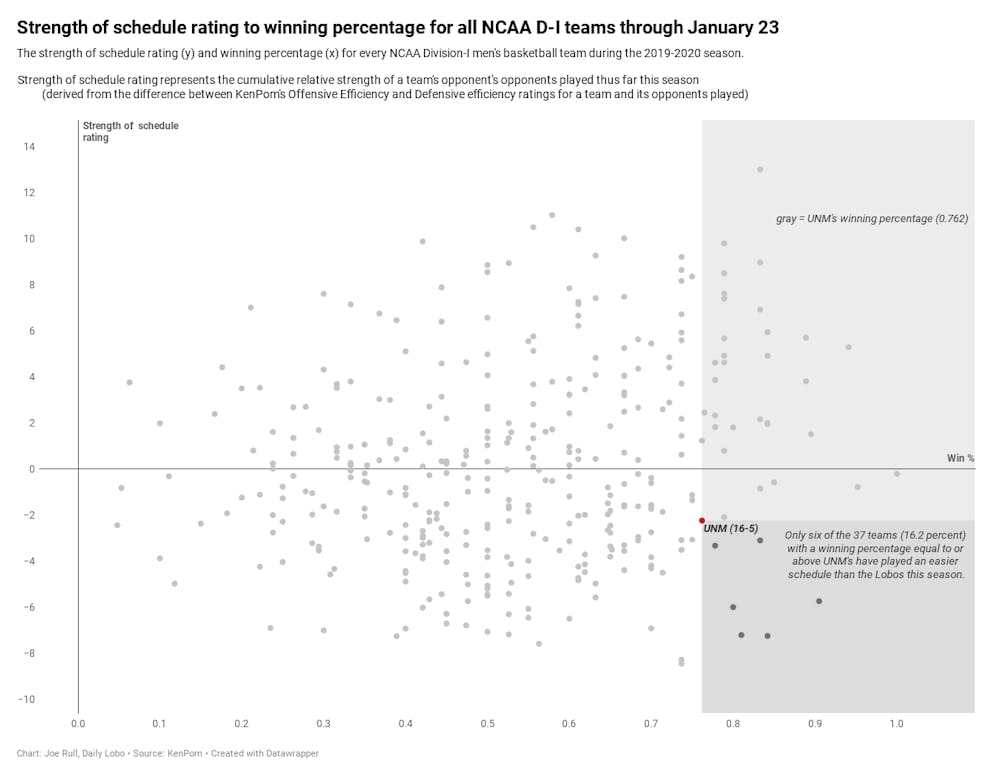
UNM gets a lot of credit for its high scoring offense, which puts up about 80 points per game and ranks top-20 in the nation. What lies beneath this is the burdensome fact that the average Adjusted Defensive Efficiency rating of UNM's opponents this year is a glaring 104.6, placing the quality of their opponents' defenses at 323rd out of the nation's 353 teams.
All told, UNM's schedule stands as the 240th toughest in the country, which really seems to dampen an already suspect resume.
Is UNM good, or is its record a product of good fortune? Thankfully for us, statistician and general hoops math deity Dean Oliver invented the aptly-named luck rating, which measures the difference between a team's actual winning percentage and the winning percentage projected by that team's game-by-game efficiencies.
Here, once more, is the entirety of the NCAA's D-I teams, this time sorted by their luck ratings and winning percentages.
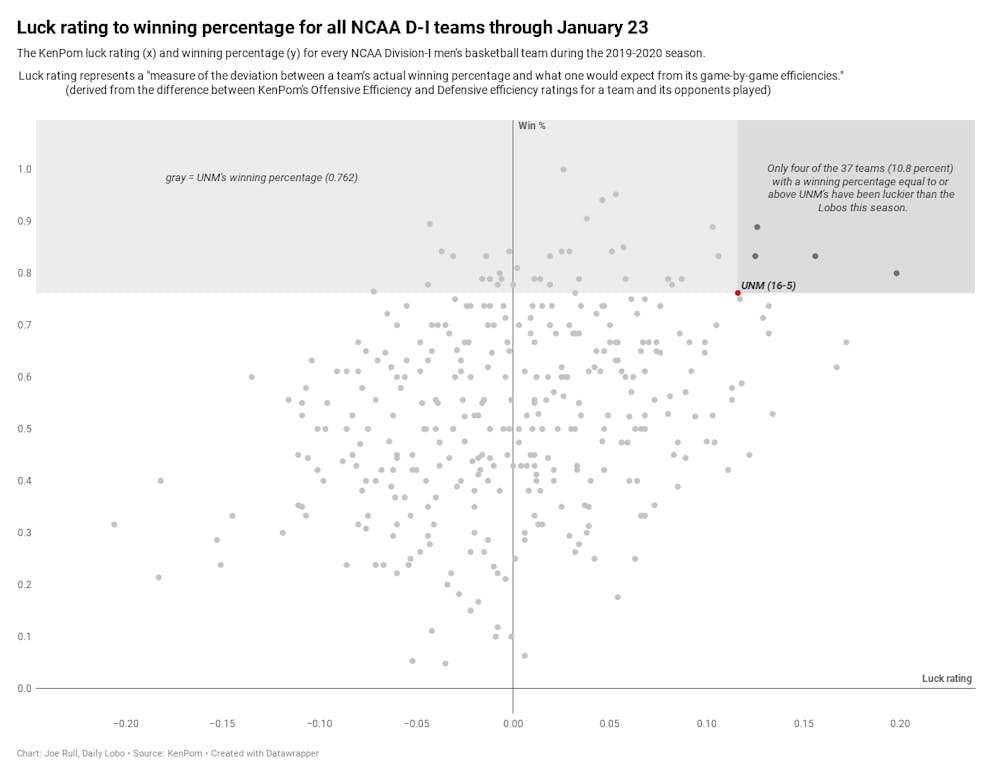
Overall, UNM has the country's 14th-highest luck rating, meaning more broadly that their game-by-game efficiency ratings and box score stats strongly show just that — this season, the Lobos are getting pretty lucky.
I'll say it. In objective, measurable, methodologically-backed ways, UNM has won more games than it should have thus far.
So is UNM a good team? The jury's still out.
As doom-and-gloom as this breakdown may seem, the Lobos have a number of reasons to be optimistic. KenPom ratings project a 5-5 finish the rest of the way, which would leave the Lobos at 21-10 with their first 20-win season since the 2013-14 campaign.
With that, they'd have a realistic shot at taking second in the conference this season (behind San Diego State, this season's last undefeated titan) and, if all goes well, maybe even a postseason tournament bid.
Then again, with the air of uncertainty around the program and the lack of any true frontcourt depth, the remainder of the season could really be a mixed bag.
Will the Lobos' luck run out? Only time will tell.
Joe Rull is the data editor at the Daily Lobo. He can be contacted at sports@dailylobo.com or on Twitter @rulljoe.